Python Debugging Basics
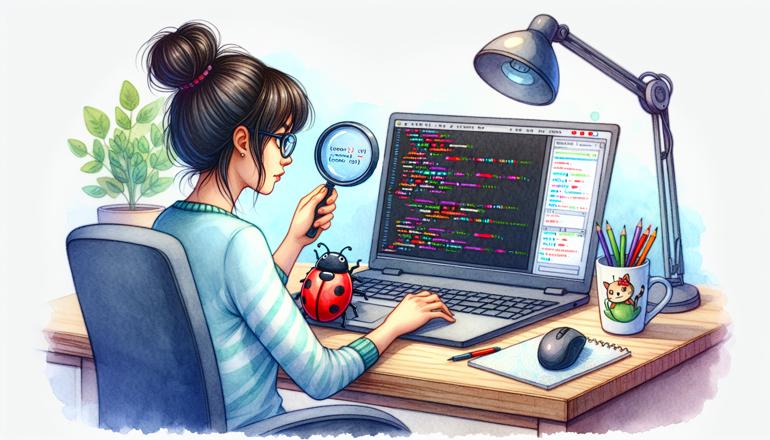
Debugging might not be the most glamorous part of programming, but it's one of the most critical skills you can develop. Whether you're just starting out or have been coding for years, knowing how to effectively find and fix bugs will save you countless hours of frustration. In this article, we're going to walk through the fundamental tools and techniques for debugging Python code.
Using Print Statements
Let's start with the simplest and most widely used debugging technique: the humble print statement. When your code isn't behaving as expected, inserting print statements can help you understand what's happening at different points in your program.
Imagine you have a function that's supposed to calculate the average of a list of numbers, but it's returning unexpected results:
def calculate_average(numbers):
    total = sum(numbers)
    average = total / len(numbers)
    return average

result = calculate_average([10, 20, 30, 40])
print(f"Average: {result}")  # Expected: 25, but getting unexpected output
By adding print statements, you can track the values at each step:
def calculate_average(numbers):
    print(f"Numbers: {numbers}")
    total = sum(numbers)
    print(f"Total: {total}")
    average = total / len(numbers)
    print(f"Average: {average}")
    return average
This approach is quick and doesn't require any special tools, but it can become messy if you have too many print statements. Remember to remove them when you're done debugging!
| Debugging Technique | When to Use | Pros | Cons |
|---|---|---|---|
| Print Statements | Simple bugs, quick checks | Easy to implement, no setup required | Can clutter code, manual cleanup needed |
Python's Built-in Debugger (pdb)
For more sophisticated debugging, Python comes with a built-in debugger called pdb. It allows you to pause your program, examine variables, and step through code line by line.
To use pdb, you can insert this line where you want to start debugging:
import pdb; pdb.set_trace()
When your program reaches this line, it will pause and enter the debugger prompt. Here are some essential pdb commands:
- n (next): Execute the next line
- s (step): Step into functions
- c (continue): Continue execution until next breakpoint
- l (list): Show the current code context
- p (print): Print variable values
- q (quit): Exit the debugger
Let's see it in action with our average function:
import pdb

def calculate_average(numbers):
    pdb.set_trace()
    total = sum(numbers)
    average = total / len(numbers)
    return average
When you run this code, the debugger will stop at the pdb.set_trace() line, allowing you to inspect variables and step through the calculation.
Common Debugging Scenarios
You'll encounter various types of bugs in your programming journey. Here are some common scenarios and how to approach them:
- Syntax errors: These are usually caught by Python before your code runs. The error message will point you to the problematic line.
- Runtime errors: Occur during execution, like division by zero or accessing non-existent list elements.
- Logical errors: Your code runs without errors but produces incorrect results - often the trickiest to find.
When facing a logical error, try to reproduce the issue with the smallest possible test case. This makes it easier to isolate the problem. Then, use either print statements or a debugger to trace through the execution.
Another powerful technique is rubber duck debugging - explaining your code line by line to someone (or something) else. Often, the act of explaining helps you spot the issue yourself.
Advanced Debugging Techniques
As you become more comfortable with basic debugging, you might want to explore more advanced techniques:
Conditional breakpoints allow you to pause execution only when certain conditions are met. This is incredibly useful when you're dealing with loops or frequent function calls.
Most modern IDEs like PyCharm, VSCode, and even enhanced terminal debuggers like ipdb support conditional breakpoints. For example, in pdb, you can set conditions like:
if some_condition:
    pdb.set_trace()
Post-mortem debugging is another valuable technique. If your program crashes with an exception, you can enter debug mode immediately after the crash to examine the state:
python -m pdb your_script.py
Watch expressions let you monitor specific variables or expressions throughout your debugging session. Most graphical debuggers support this feature, allowing you to see how values change in real-time.
| Debugging Tool | Best For | Learning Curve |
|---|---|---|
| Print Statements | Quick checks, simple bugs | Very low |
| pdb | Medium complexity issues | Moderate |
| IDE Debuggers | Complex projects, visual learners | Varies by IDE |
Debugging in Integrated Development Environments
Modern IDEs offer powerful graphical debugging tools that make the process more intuitive. Here's why you might want to use an IDE debugger:
- Visual breakpoint management
- Variable inspection windows
- Call stack visualization
- Step-through execution with buttons
- Watch windows for monitoring variables
In PyCharm or VSCode, you can set breakpoints by clicking in the gutter next to line numbers. When you run your code in debug mode, it will pause at these breakpoints, allowing you to inspect the current state.
The debugger interface typically includes: - Variables panel showing current values - Watches for specific expressions - Call stack showing function hierarchy - Console for executing commands
Learning to use your IDE's debugger effectively can dramatically improve your debugging efficiency. Take time to explore the features available in your preferred development environment.
Common Pitfalls and How to Avoid Them
Even experienced developers make debugging mistakes. Here are some common pitfalls and how to avoid them:
- Not reading error messages carefully: Python's error messages are usually quite descriptive. Take time to understand what they're telling you.
- Making multiple changes at once: When debugging, change one thing at a time so you know what fixed the issue.
- Assuming rather than verifying: Don't assume you know what a variable contains - always verify with print or debugger.
- Not using version control: Git allows you to experiment freely knowing you can always revert changes.
Remember that debugging is a skill that improves with practice. The more you do it, the better you'll become at quickly identifying and fixing issues.
Creating Effective Test Cases
Good debugging often starts with good testing. When you encounter a bug, try to create a minimal test case that reproduces the issue. This helps in several ways:
- Isolates the problem from other code
- Makes it easier to share with others for help
- Provides a way to verify when the bug is fixed
- Can be added to your test suite to prevent regression
Here's an example of creating a test case for our average function:
def test_average_calculation():
    # Test basic functionality
    assert calculate_average([1, 2, 3]) == 2
    # Test empty list (should handle gracefully)
    try:
        calculate_average([])
        assert False, "Should have raised an error"
    except ZeroDivisionError:
        pass
    # Test with negative numbers
    assert calculate_average([-1, 0, 1]) == 0
Having good test cases not only helps with debugging but also prevents future bugs when you make changes to your code.
Debugging Best Practices
Developing good debugging habits will make you a more effective programmer. Here are some best practices to follow:
- Start with the simplest solution: Often, the bug is something obvious you overlooked
- Take breaks: Sometimes stepping away from the problem helps you see it fresh
- Use version control: Commit often so you can easily revert changes that introduce new bugs
- Document what you learn: Keep notes on tricky bugs and their solutions
- Ask for help: Don't struggle too long alone - fresh perspectives can spot issues quickly
The most important debugging skill is systematic thinking. Approach each bug methodically: reproduce the issue, isolate the cause, fix it, and verify the fix works.
Remember that every programmer deals with bugs - it's a normal part of the development process. The goal isn't to write perfect code on the first try, but to develop the skills to efficiently find and fix issues when they arise.
Happy debugging! With practice and patience, you'll find that solving puzzles in your code can be just as rewarding as writing new features.


