- Master Python with tutorials and tips on CodeStips.

Learn how to use Python libraries like Matplotlib and Seaborn to create effective visualizations for comparing groups, including code examples and best practices.

Learn to compute and interpret correlations in Python using popular libraries, essential for data analysis, machine learning, and research.

Data standardization is a key preprocessing technique that rescales features to have a mean of 0 and standard deviation of 1, improving model performance and convergence in machine learning and statistics.

Seaborn simplifies data visualization in Python by offering a high-level interface built on Matplotlib. It helps create attractive and informative statistical graphics with less code and more polish.
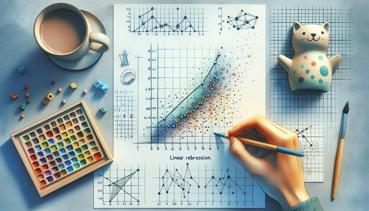
Linear regression is a simple machine learning tool that finds a best-fit straight line to make predictions based on observed data patterns.

Learn how to create interactive scatter plots with Plotly to visualize relationships, clusters, trends, and distributions in your Python data.
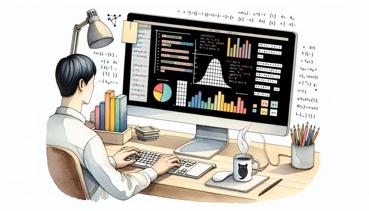
Python's built-in statistics module offers powerful, lightweight tools for data analysis without external libraries. Explore practical projects to summarize datasets and derive insights efficiently.

Python provides tools like Pandas, Matplotlib, and Seaborn for analyzing trends in sales, traffic, or stock data over time.
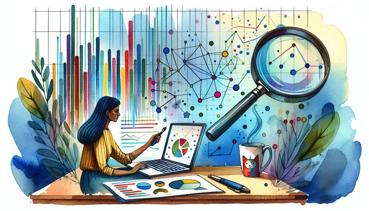
Data analysis turns overwhelming information into clear, actionable insights, making it a vital skill in today's world.