- Master Python with tutorials and tips on CodeStips.

Learn to build K-Means clustering from scratch in Python without machine learning libraries. Step-by-step implementation guide for beginners and enthusiasts.

Learn to install Jupyter Notebook on macOS for data analysis and prototyping, with tips on managing Python environments and initial setup.

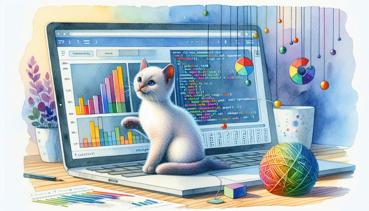
Seaborn simplifies data visualization in Python by offering a high-level interface built on Matplotlib. It helps create attractive and informative statistical graphics with less code and more polish.
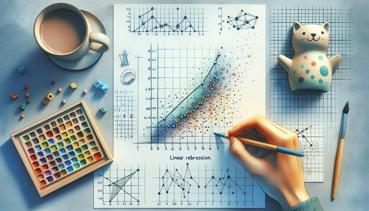
Linear regression is a simple machine learning tool that finds a best-fit straight line to make predictions based on observed data patterns.

Optimize DataFrame memory usage to prevent slow performance and crashes when handling large datasets. Learn essential techniques for efficient data analysis.

Learn how NumPy's array operations enable efficient numerical computations, offering high performance for handling large datasets and matrices in Python.

Overfitting occurs when a model learns training data too well, including noise, making it perform poorly on new data. Underfitting happens when a model fails to capture patterns in the data, resulting in poor performance overall.

Plotly is a Python library for creating interactive, web-based charts and visualizations, ideal for dynamic data exploration and storytelling.

Learn how to create interactive scatter plots with Plotly to visualize relationships, clusters, trends, and distributions in your Python data.
Master the essentials of Python data analysis with this guide to key libraries like pandas, NumPy, and Matplotlib. Learn workflows and functions for efficient data handling and visualization.